
Key takeaways
Writing growth is hard to track because consistent rubric-aligned scoring at scale has been nearly impossible.
Core obstacles: grading takes too long, scoring varies between teachers, data never reaches leadership.
Real growth data needs rubric-level resolution — which dimensions improved, not just an overall score.
AI scoring is the prerequisite — inconsistent rubric application makes growth data unreliable.
EnlightenAI's Growth Analytics shows proficiency trends and insights filterable by school, grade, and teacher.
You can tell a student improved at math because the scores go up. You can track reading growth with MAP or i-Ready. But writing? Writing growth has always been the black box of K-12 data.
Not because it doesn't matter — everyone agrees it does. But because tracking student writing growth requires consistent rubric-aligned scoring across multiple assignments, over time, at scale. And until recently, that has been nearly impossible for most schools to pull off.
The result is a frustrating gap: teachers know their students are becoming better writers, but they can't prove it with data. School leaders want to see writing proficiency trends across classrooms and grade levels, but the information doesn't exist in any usable form. And when it comes time to make decisions about curriculum, professional development, or intervention, writing is the one subject area where leadership is essentially flying blind.
This post is about how to close that gap — what it actually takes to measure student writing progress over time, why most schools haven't been able to do it, and how the right infrastructure makes it possible.
The challenge isn't philosophical. Everyone agrees that writing should be assessed frequently, scored consistently, and analyzed over time. The problem is operational.
Scoring takes too long. A single round of rubric-aligned essay grading for 120 students can take a teacher 10-12 hours. Do that across multiple assignments and the math breaks down fast. Most schools simply can't generate enough scored data points to build a meaningful picture of growth.
Consistency varies. Even when teachers grade frequently, calibration against a scoring rubric drifts from teacher to teacher and even assignment to assignment. Without consistent scoring, comparing performance across time is unreliable — you're not measuring student growth, you're measuring scorer variation.
Data doesn't roll up. When individual teachers grade in isolation, results live in spreadsheets, gradebooks, and filing cabinets. There's no system that aggregates rubric-level writing scores across classrooms, schools, or a district in a seamless way that leadership can actually use.
The net effect: schools have plenty of writing happening, but almost no longitudinal writing data. And without that data, tracking student writing growth over time is guesswork.
If you could design the ideal system for tracking student writing progress, it would have a few properties.
Rubric-level resolution. You don't just want to know that a student's "writing score" went up. You want to know which dimensions improved. Did organization get stronger while evidence use stayed flat? Are conventions improving faster than analysis? Rubric-level data tells you where growth is actually happening — and where it isn't.
Multiple data points across time. Two snapshots aren't enough. Growth becomes visible when you can see performance across three, four, or more assignments using the same or similar rubric. That's when trends emerge and you can distinguish real improvement from assignment-to-assignment noise.
Filters that let you disaggregate. A district-level average is useful, but the real insight comes when you can break it down — by school, by grade level, by teacher, by course, and by student demographic group. That's how you identify which classrooms are driving growth and which need support. That’s how you spotlight and scale up best practices.
Writing fluency metrics alongside rubric scores. Curriculum-based measurement data — words written, correct word sequences, words spelled correctly — provides a complementary signal. When fluency metrics move in the same direction as rubric scores, you have strong evidence that students are developing as writers.
AI-generated insights, not just charts. Raw data is only as useful as the analysis layered on top. The best growth data comes with plain-language interpretation: what are the strengths across this cohort, where are the gaps, and what should instruction focus on next?
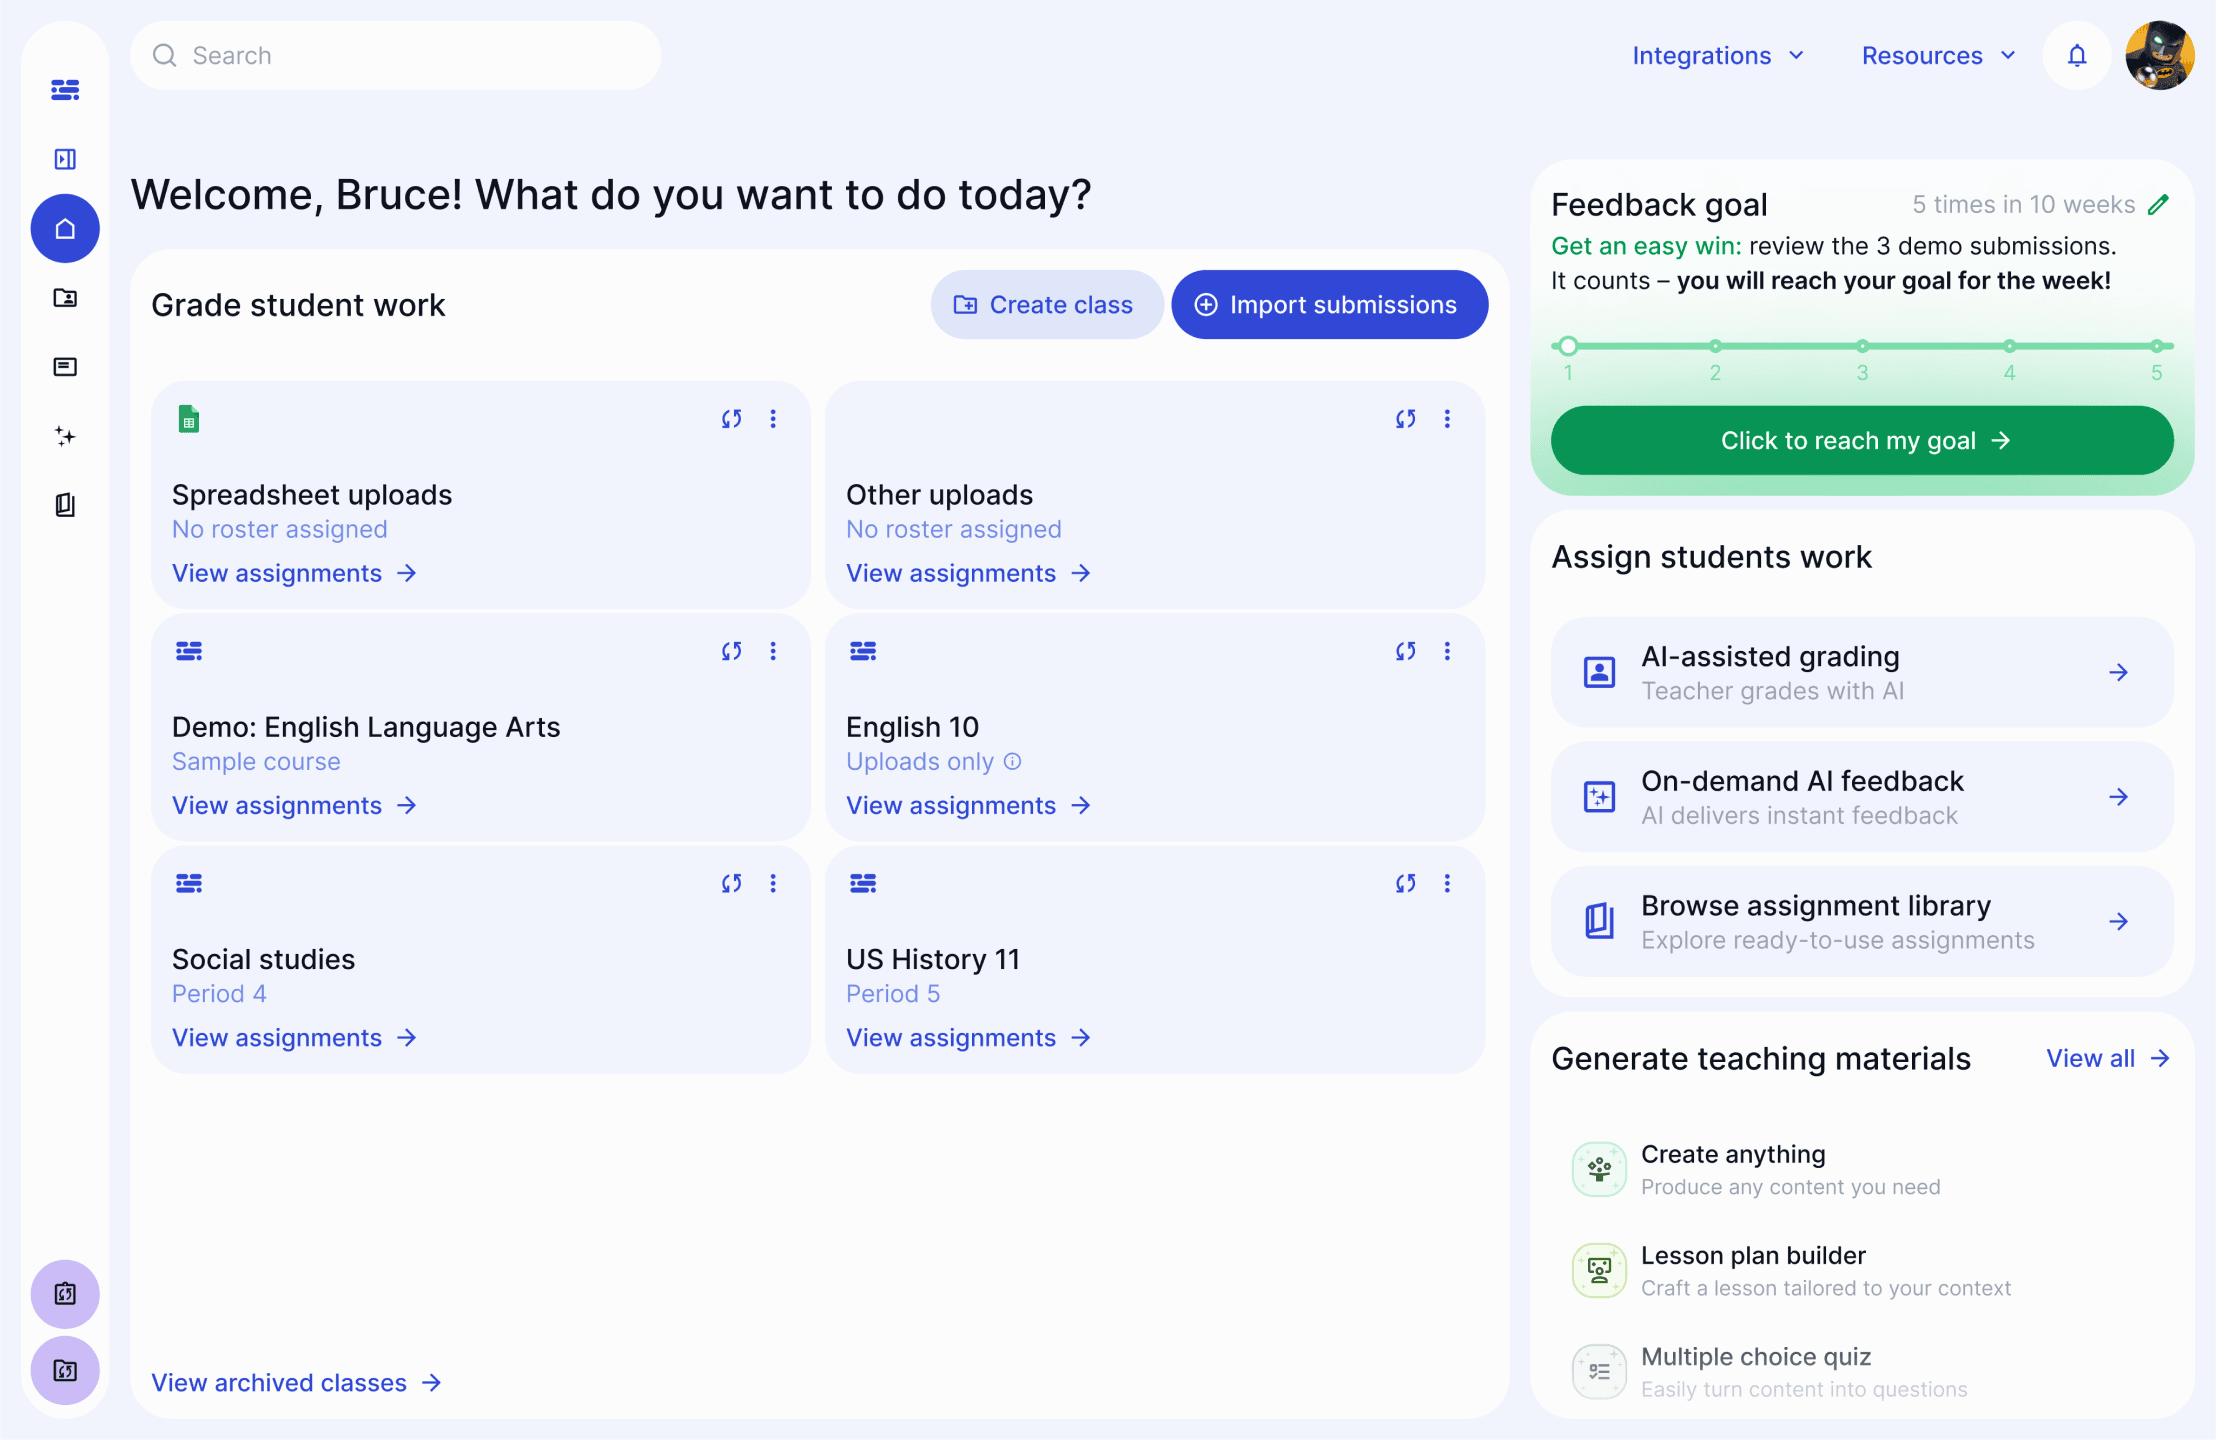
EnlightenAI helps teachers deliver instant, rubric-aligned writing feedback so students can practice, revise, and improve faster.
This is exactly what we built our new Growth Analytics tool to do. It's available now for all Clever-synced school and district partners, and we're working on expanding access soon.
Here's how it works: from the admin console, you select multiple assignments that share the same rubric:
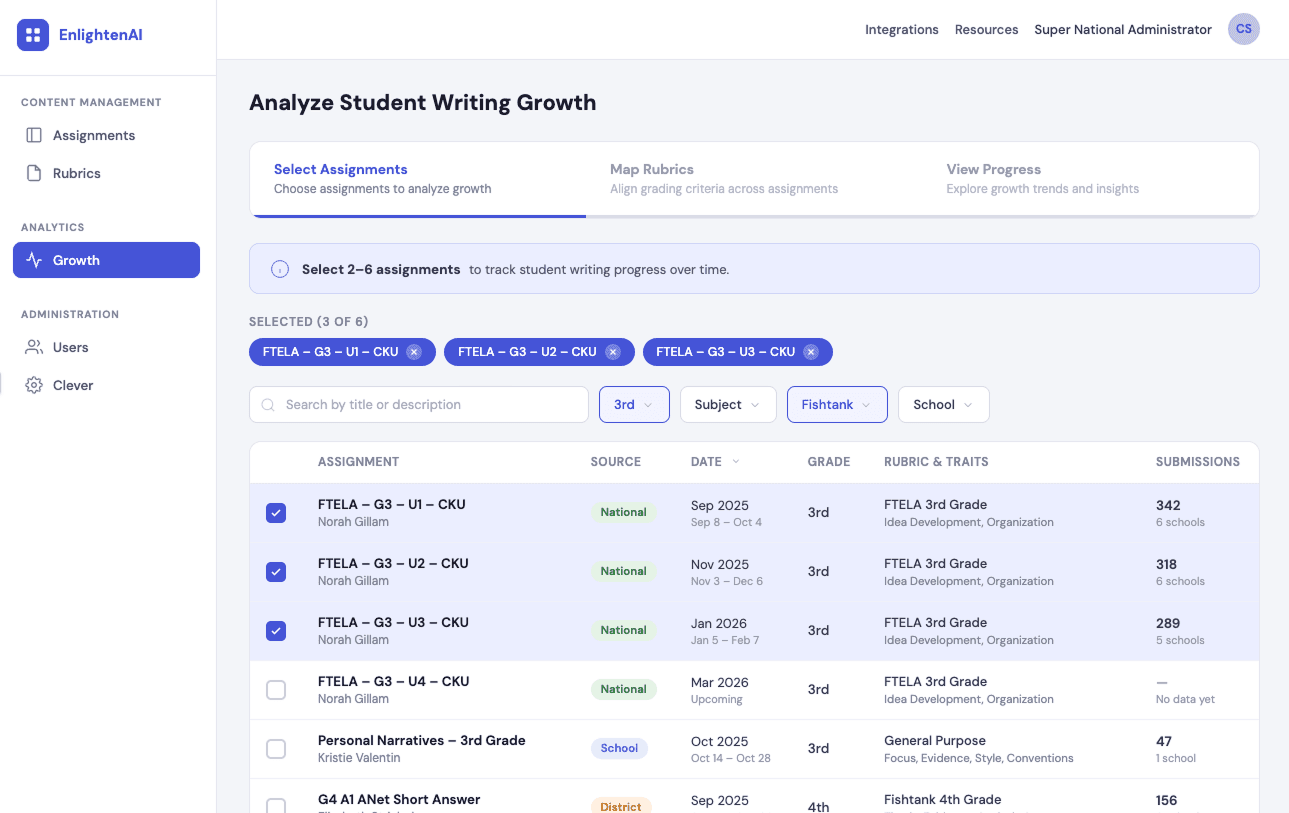
The system validates that the rubrics are comparable — same number of criteria, same point scales — and then generates a complete longitudinal view of student writing growth across those assignments.
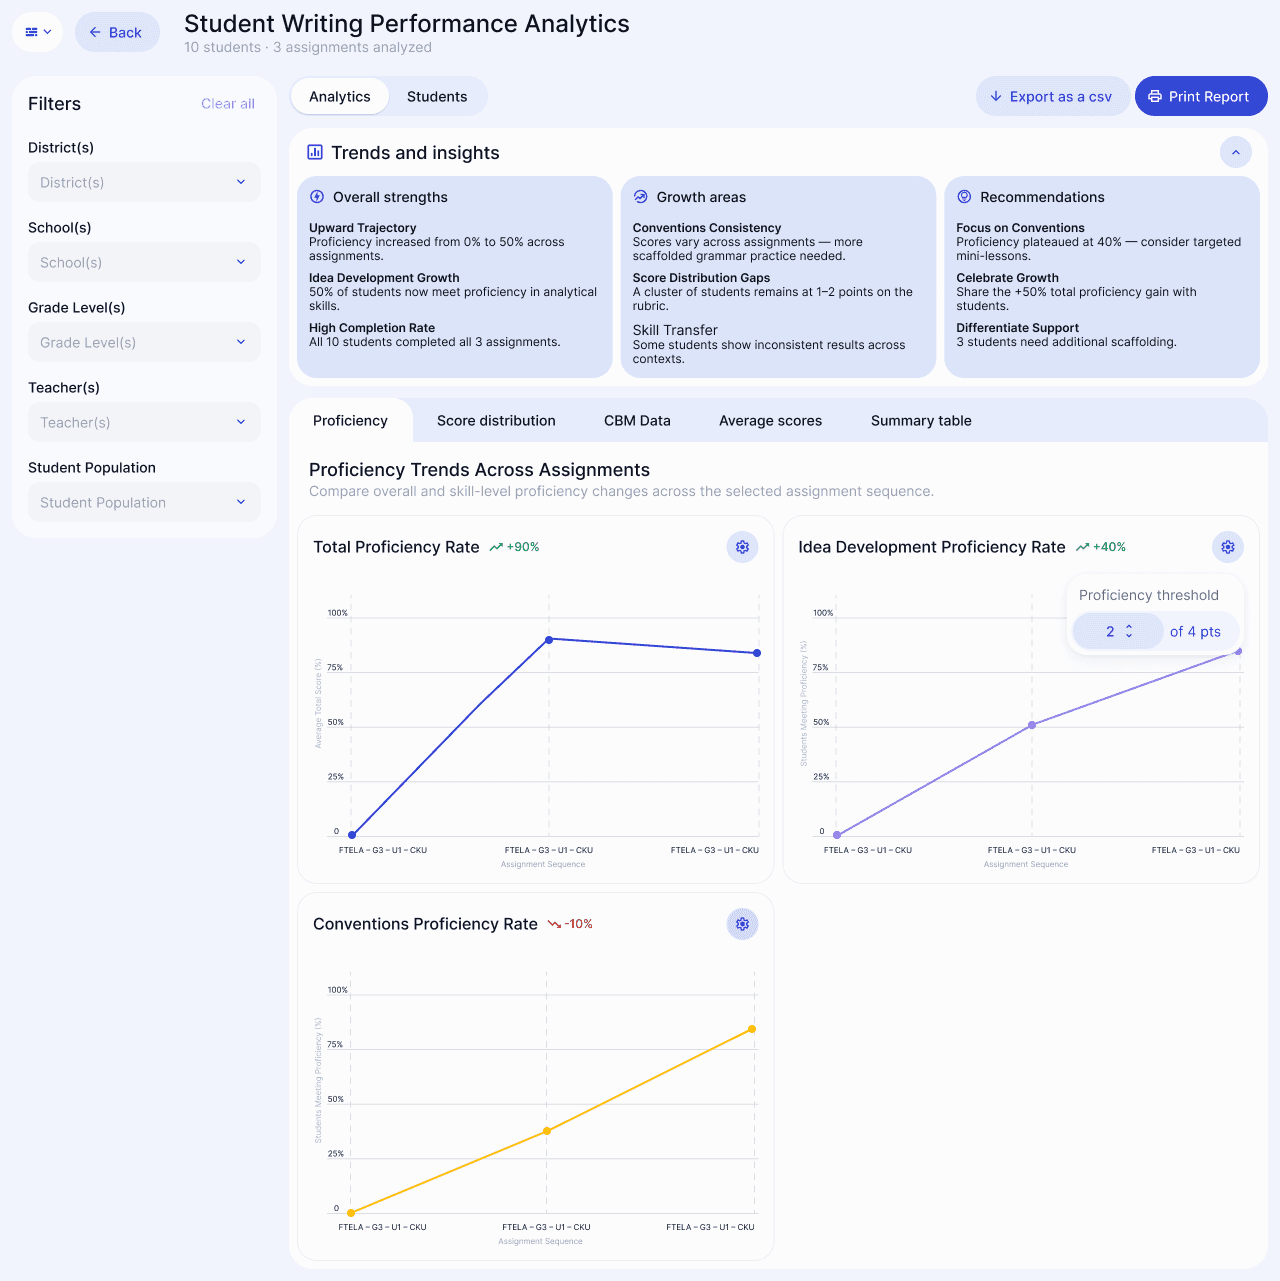
Proficiency trends show you, for each rubric category, what percentage of students are meeting your proficiency threshold — and how that rate is changing over time. You can adjust the threshold to match your definition of proficient, and the numbers update instantly.
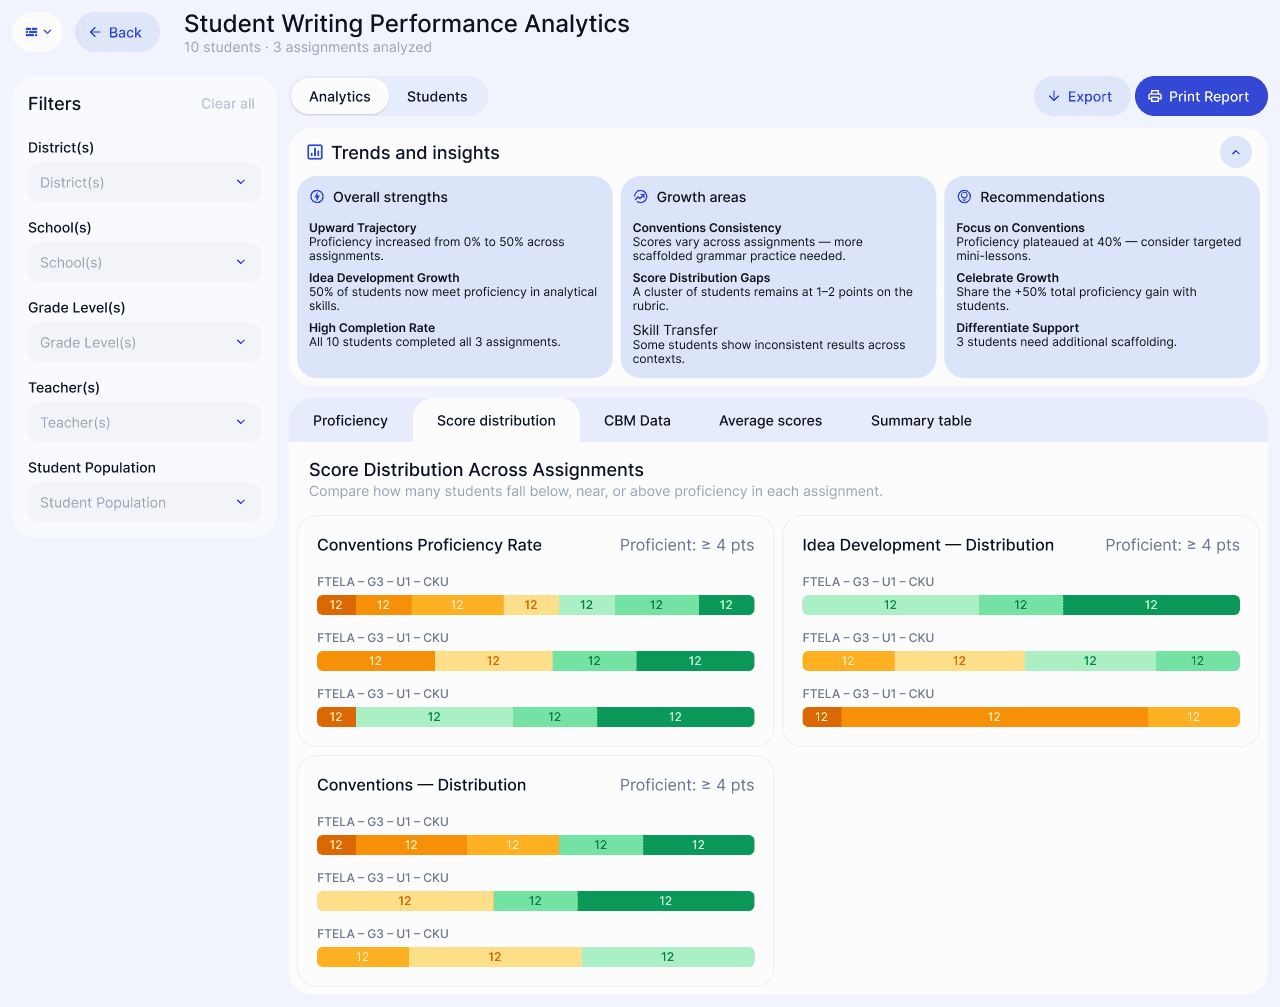
Score distributions visualize how the full range of student performance is shifting. You want to see green (proficient) growing and lower bands shrinking. When that's happening, you know instruction is working.
Writing fluency metrics — words written, correct word sequences, words spelled correctly — are tracked alongside rubric scores, giving you a multi-dimensional picture of student writing development.
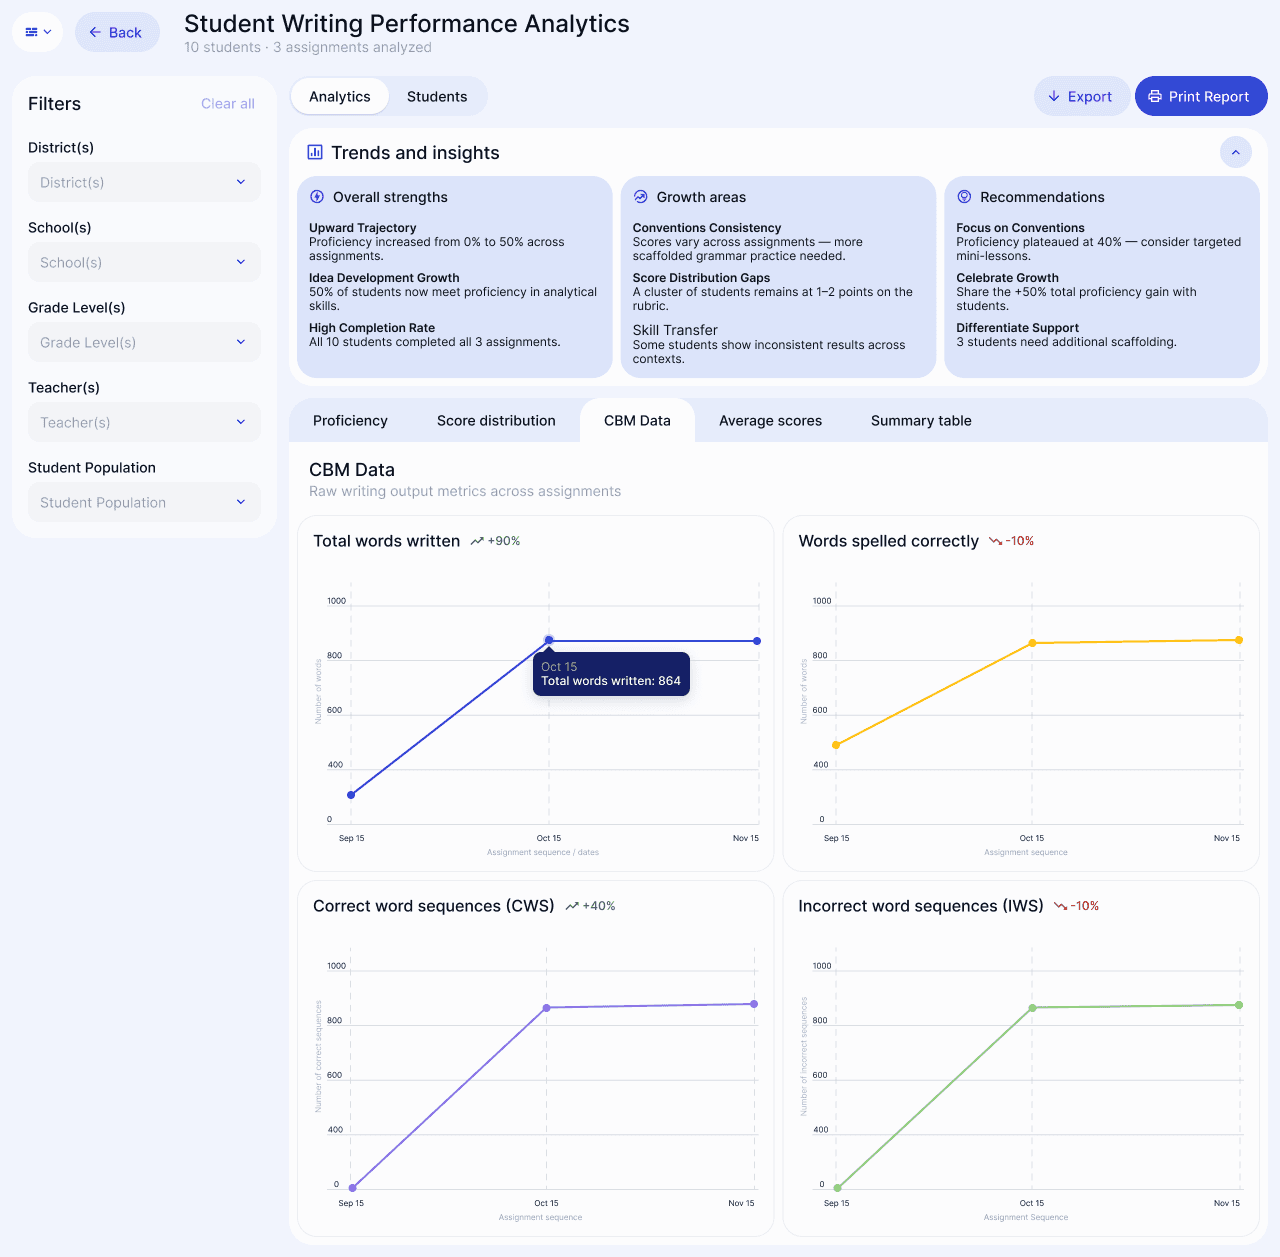
For all of these trends, you'll receive AI-generated insights that surface the patterns in plain language: what's strong across the cohort, where growth areas remain, and specific recommendations tied to what the rubric data is showing. No more staring at a spreadsheet trying to figure out what it means.
And crucially, every view is filterable — by school, teacher, grade level, course, and student demographics — so you can drill into exactly the questions you need answered.
🎥 Watch a 5-minute walkthrough of Growth Analytics to see how it works in practice.
For individual teachers, growth data validates the work they're already doing and shows them where to focus next. For school and district leaders, it provides something that has never existed at scale: a continuous, comparable picture of writing achievement across classrooms and over time.
That data changes what's possible. Professional development decisions can be grounded in actual student performance patterns, not anecdotal reports. Curriculum investments can be evaluated based on measurable writing outcomes. And schools can finally answer the question that matters most: are our students becoming better writers?
Schools and districts across the country — including KIPP, Uncommon Schools, and DREAM Charter Schools — are already using EnlightenAI to build the kind of writing data infrastructure that makes this possible. Growth Analytics is the next step: turning all of that scored writing into a picture of progress that everyone from the classroom teacher to the chief academic officer can see and act on.
Ready to see Growth Analytics in action? Book 20 minutes with our team to learn how EnlightenAI can help your school or district track student writing growth.
Tracking writing growth requires one thing above all else: a consistent scoring standard across every checkpoint. If rubric interpretation drifts, or if different teachers score differently, the growth data is meaningless. Consistent AI scoring is the prerequisite that makes growth tracking worth doing.
Start building data you can actually act on, try the AI grading tool.
A semester-long writing portfolio only tells a story if every checkpoint used the same measurement standard. When the AI essay grader applies the same rubric at every checkpoint, the scores are directly comparable, not approximately, but exactly. Comparable data is what turns a collection of essays into a growth trajectory.
Apply the same rubric at every checkpoint, try the AI essay grader.